
Getting started
This tutorial walks you through the plugin from first activation to a live chart on your dashboard. By the end you will have built a real chart, added it to a report, and pinned it to the Shopware dashboard — the complete first-run happy path.
Time to complete: approximately 10–15 minutes.
Prerequisites:
- The Advanced Analytics Dashboard plugin is installed and activated in your Shopware 6.7 shop.
- Your admin user has the
ssd_analytic.viewer,ssd_analytic.creator, andssd_analytic.editorACL roles (or full admin access).
Step 1 — Open the Analytics module
In the Shopware admin, click Marketing in the left navigation, then select Analytics.
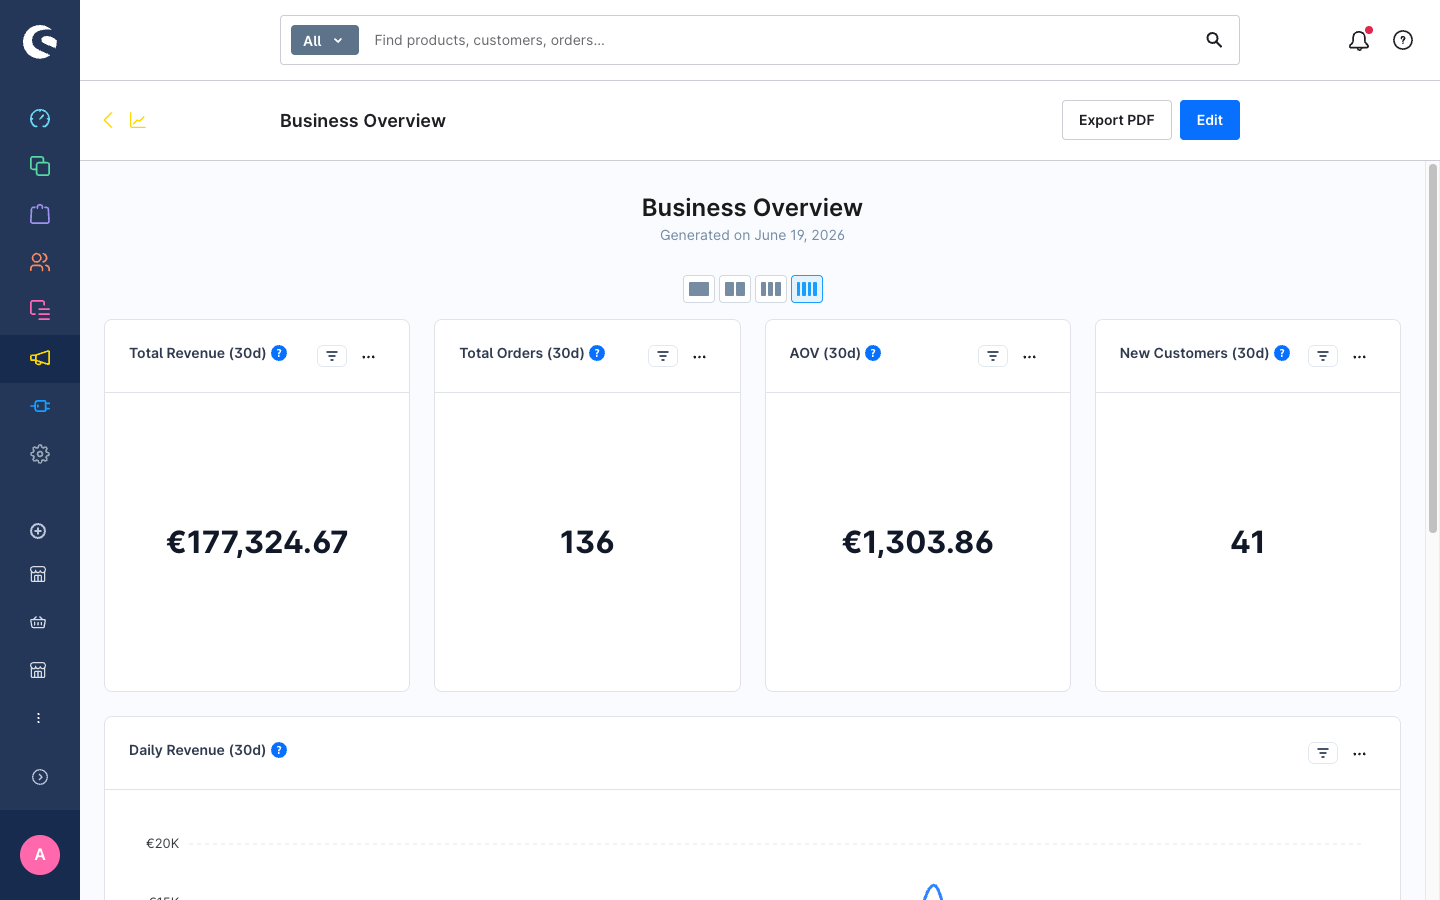
The plugin seeds a set of demo charts and an "Overview" report on first install. This gives you something to explore right away. The overview report is pre-set as the Analytics landing page.
Step 2 — Explore the seeded Overview report
The default view opens the Overview report. You will see a grid of charts — revenue trends, order counts, customer registrations, and order state distribution — all pre-configured with the last_30d date range.
Take a moment to try the quick-edit controls on any chart card:
- Click the filter icon on a chart card to open the filter bar.
- Change the Date range to "Last 7 days" and observe the chart update.
- Switch the Time granularity between Day and Week to see the bucketing change.
These controls adjust the chart for your current session; they do not save back to the stored configuration.
Step 3 — Navigate to the chart library
Click Charts in the top navigation of the Analytics module (or use the ssd.analytics.chart.list route).
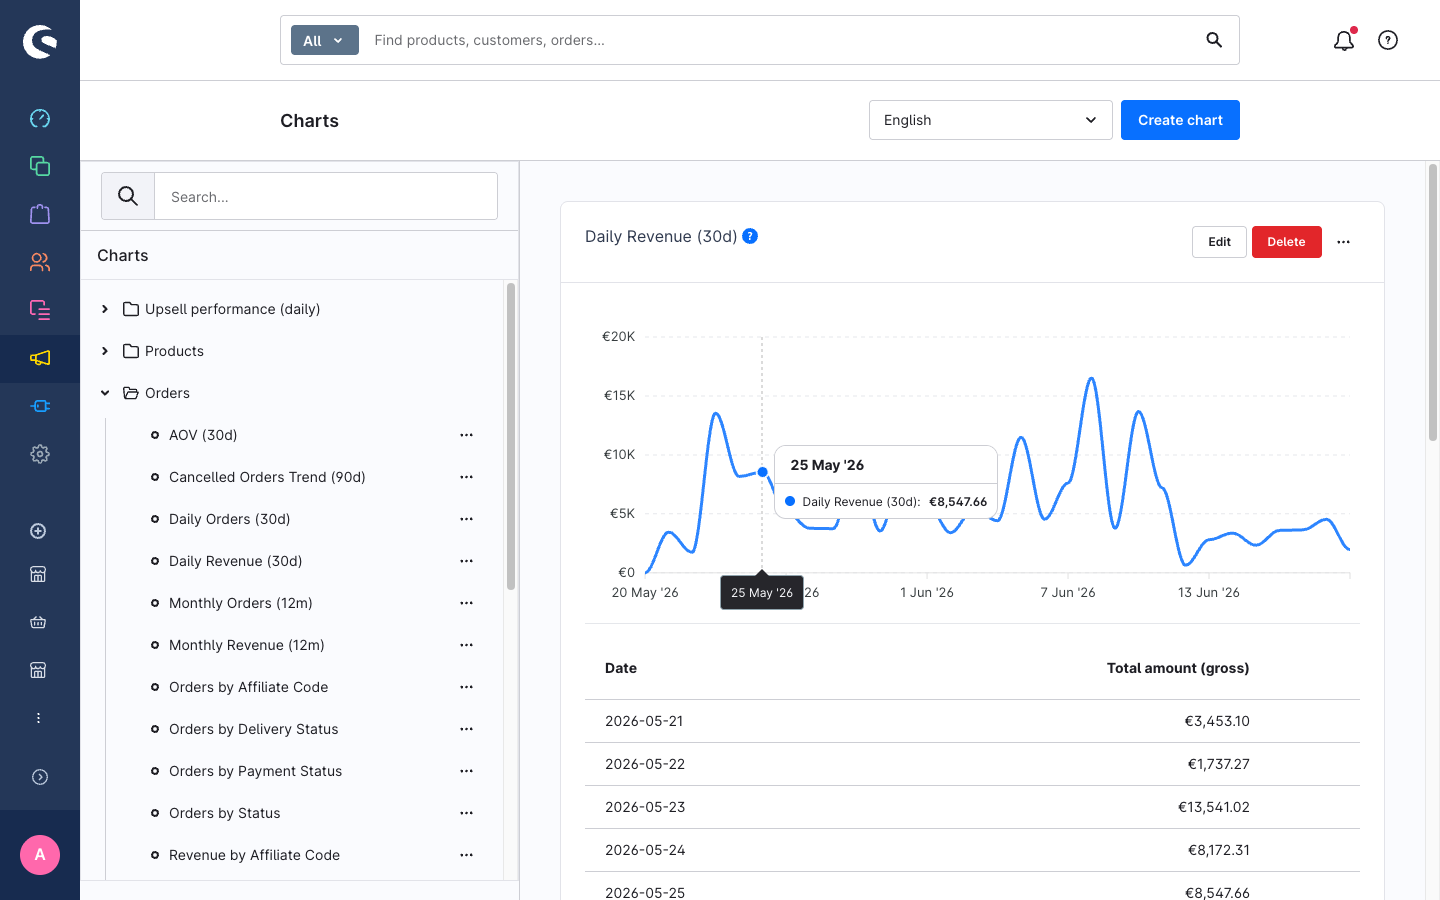
The chart list shows all your charts in a tree on the left. Clicking any chart loads a live preview on the right, along with the underlying data table below it.
Step 4 — Create your first chart
Click Create chart in the top right (smart bar).
On the chart creation page, fill in:
- Title — for example, "Revenue last 30 days"
- Data source — select Orders
- Metric — select Sum
- Metric field — select Total amount (amount_total)
- Chart type — select Line
- Date range — select Last 30 days
The preview on the right updates as you configure each field.
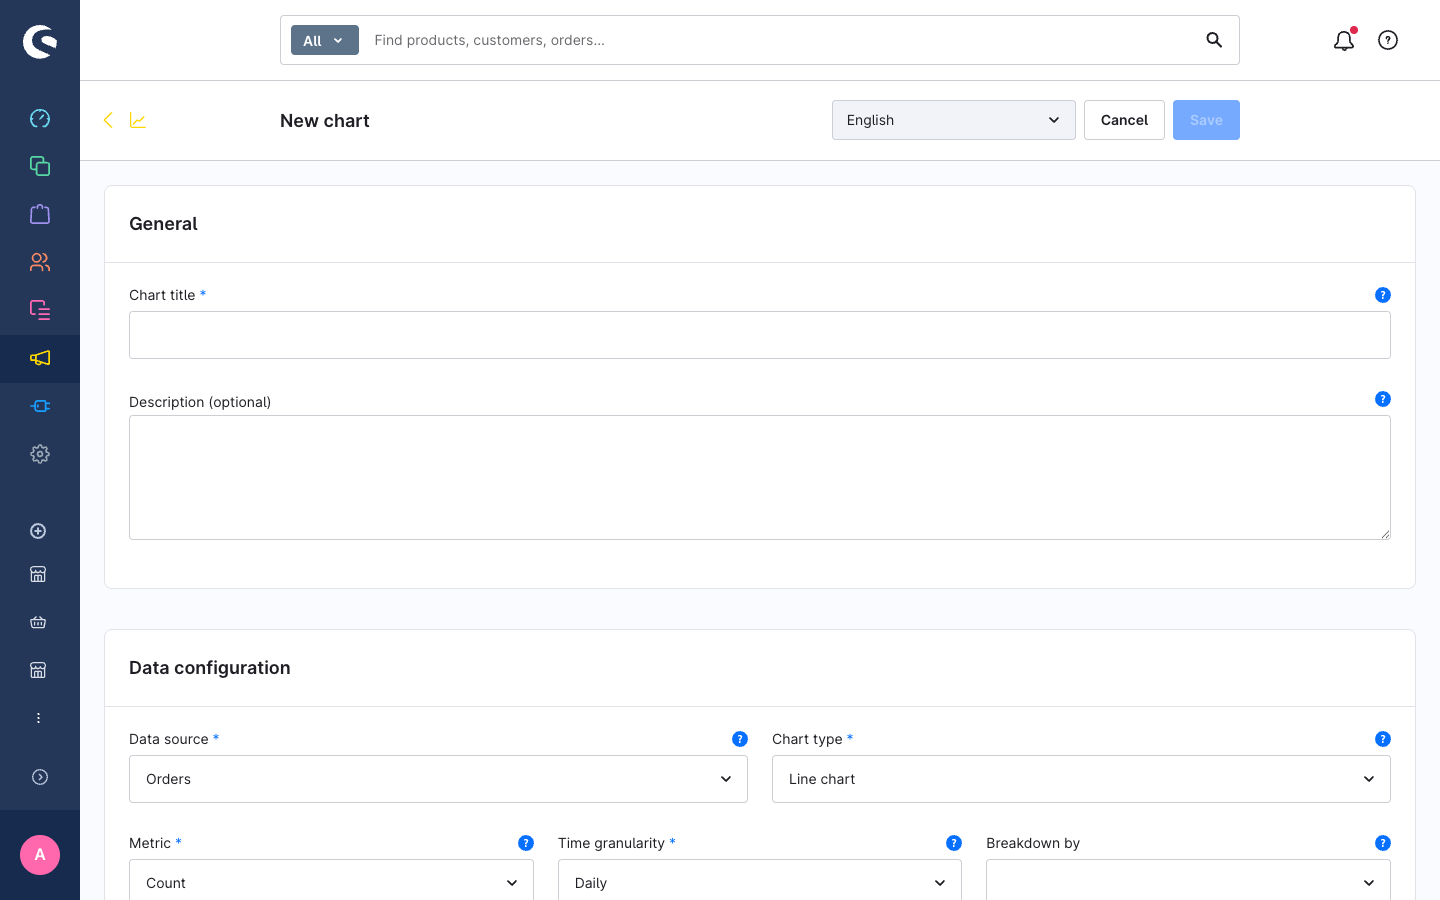
- Optionally, enable Compare to previous period to add a dashed previous-period line and a delta badge.
- Click Save in the smart bar.
Your chart is now saved in the chart library.
Step 5 — Create a report and add your chart
- Click Reports in the Analytics navigation.
- Click Create report.
- Enter a Name for the report, for example "My First Report".
- Click Add chart and find the chart you just created in the picker modal. Select it and confirm.
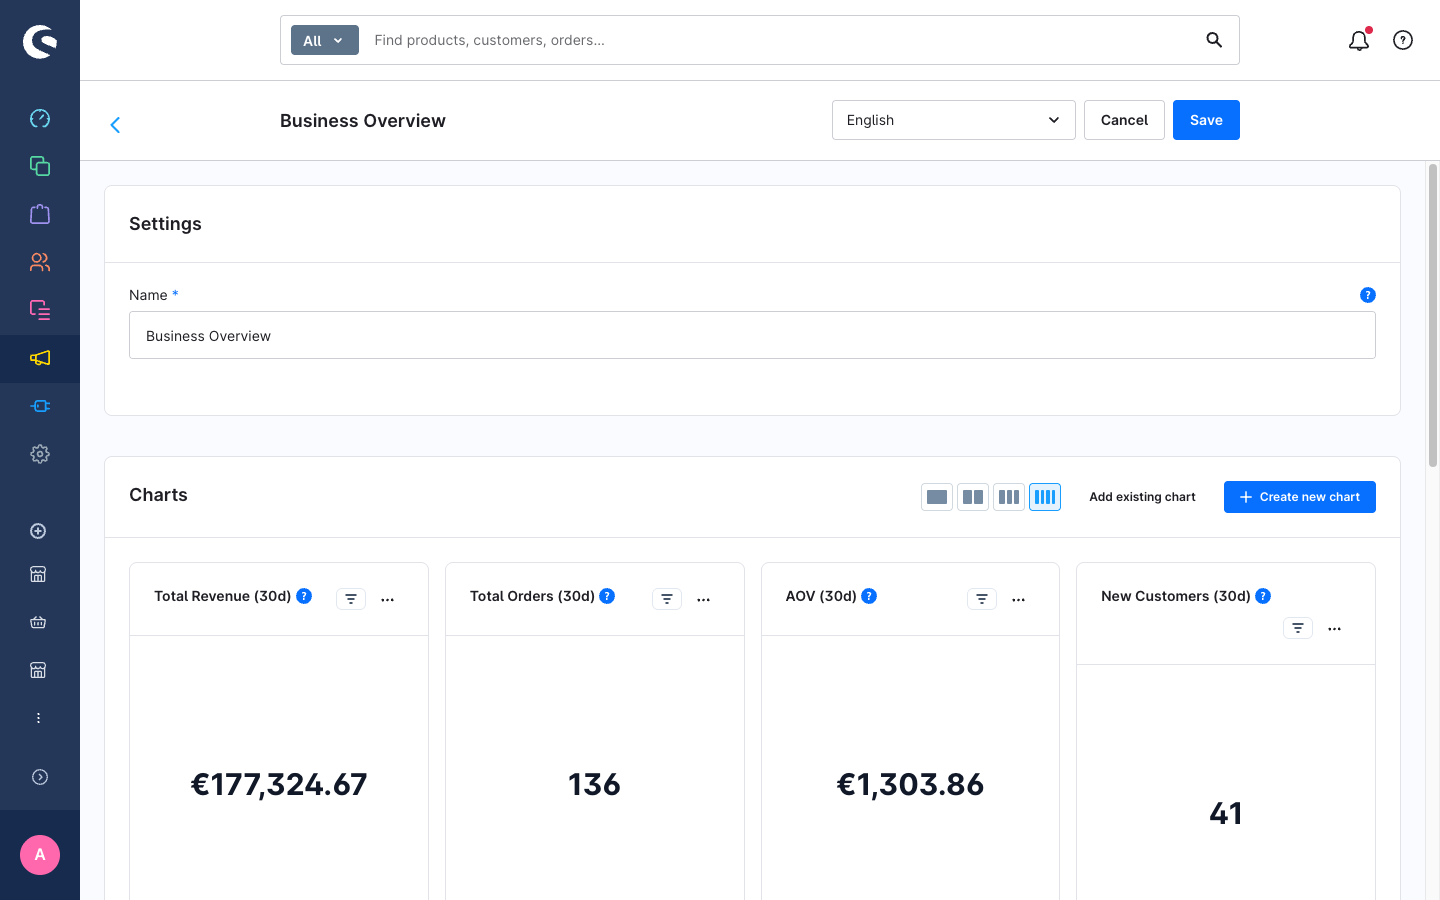
- The chart appears in the report grid. You can drag the right edge of the chart card to adjust its column span.
- Click Save.
Step 6 — View the report
Click View in the smart bar (or navigate to the report view page). The report renders in read-only mode — no edit controls, just your charts and the export options.
Step 7 — Pin a chart to the Shopware dashboard
- Open the context menu (the three-dot icon) on any chart card in the report view.
- Click Pin to dashboard.
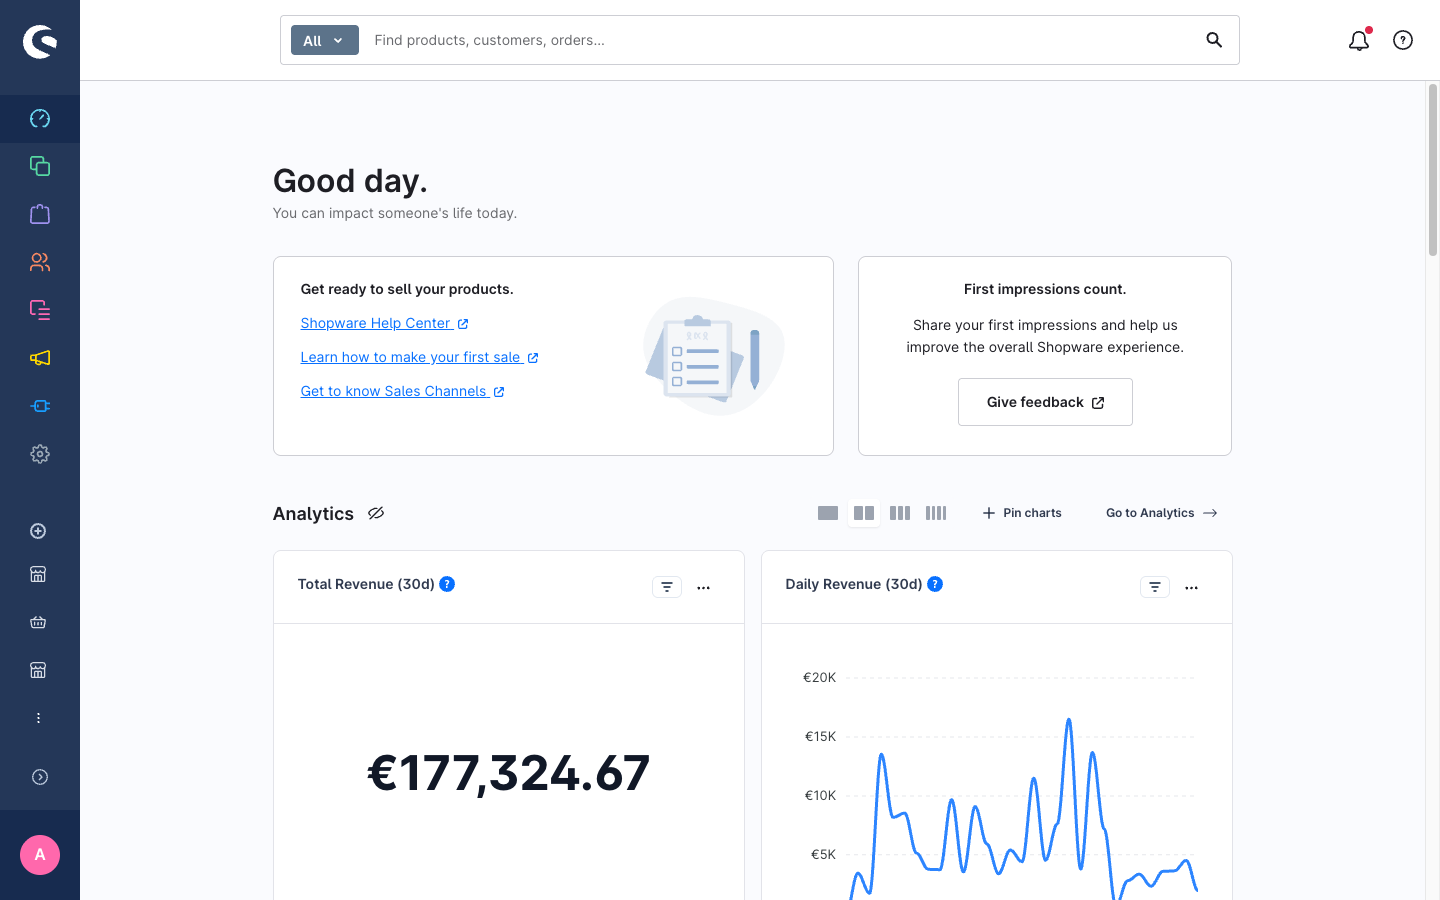
A success notification confirms the pin. Navigate to Dashboard (the Shopware home icon) to see your pinned chart in the Analytics section.
What's next
- Create a chart — detailed walkthrough of every chart configuration option including the filter builder, breakdown, and comparison toggle.
- Build a report — multi-chart reports, column layout, drag-resize spans, and the unsaved-changes guard.
- Export data — CSV export per chart, PDF export for a full report.
- Configuration reference — all plugin settings and entity definitions.