
How to pin charts to the dashboard
Pinning a chart adds it to the Analytics section on the Shopware dashboard (the admin home screen). This lets you see your most important KPIs at a glance without opening the Analytics module.
Pin a chart
Charts can be pinned from three places:
- Report view: open the context menu (three-dot icon) on any chart card, then click Pin to dashboard.
- Report edit: same three-dot context menu on any chart card in the edit grid.
- Chart list: select a chart in the tree, then use the context menu in the preview pane header.
A success notification confirms the pin. The chart's pinned_to_dashboard flag is set to true and it appears in the dashboard section on next page load.
View and manage pinned charts
Navigate to Dashboard (the Shopware home icon in the sidebar). The Analytics section appears at the top of the dashboard with all currently pinned charts.
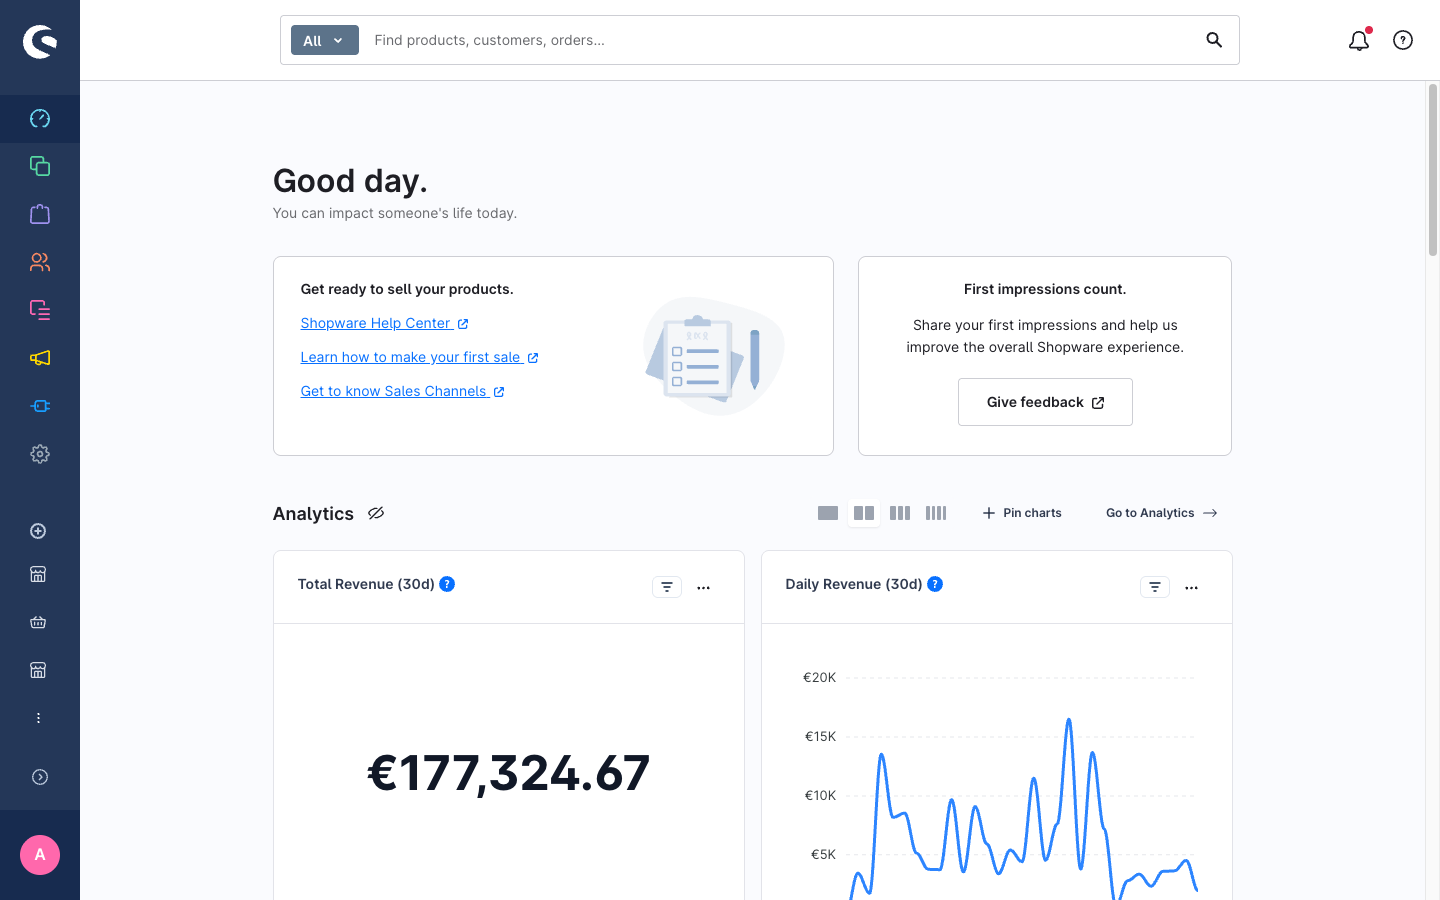
Reorder pinned charts
In the dashboard Analytics section, drag and drop chart cards to reorder them. A Save order button appears when you have made changes; click it to persist. Click Discard to revert.
Resize pinned charts
Each dashboard chart card has a drag handle on its right edge. Drag to snap the card to 1 or 2 columns. Span preferences per chart are saved per admin user in their browser's local user settings — each admin can have their own dashboard layout.
Set the column count
The dashboard Analytics section has a column layout selector (1–4 columns). This preference is stored per user in localStorage.
Unpin a chart
Open the context menu on a pinned chart card and click Unpin from dashboard. The card is removed from the dashboard; the chart still exists in the library.
Hide the dashboard section
If you want to remove the Analytics section from the dashboard entirely (for example, to reduce noise for admin users who don't use it), enable Hide Analytics section on dashboard in Settings > Extensions > Advanced Analytics Dashboard > General settings.
To restore the section, return to the plugin settings and disable the toggle. See Configuration reference for the hideDashboardSection setting.
Next steps
- Export data — export pinned chart data as CSV.
- Set the overview report — configure the Analytics module landing page.