
How to export data
The plugin supports two export formats: CSV per individual chart, and PDF for a full report page.
Export a chart as CSV
A CSV export is available on any chart, from any view where the chart card's context menu is accessible.
- Open the context menu (three-dot icon) on the chart card.
- Click Export CSV.
- The browser immediately downloads a
.csvfile named after the chart title.
The CSV contains the same data the chart currently displays — the current date range, active filters, and breakdown (if any). If you adjust the date range or granularity via the quick-edit filter bar before exporting, the CSV reflects those temporary overrides.
CSV structure:
- For time-series charts (line, bar): one row per time bucket with columns for the date and metric value. If a breakdown is active, separate columns or rows appear per breakdown segment.
- For pie/donut charts: one row per segment with label and value columns.
- For number cards: a single row with the aggregated value and, when previous-period comparison is enabled, the previous value and delta.
- For table charts: one row per data row, same columns as shown in the admin UI.
Export a report as PDF
The PDF export captures all chart cards in the current report view as a single downloadable file.
- Navigate to the report view page (click View in the smart bar from the report edit page).
- Click Export PDF in the smart bar.
- The button enters a loading state while the charts are captured. When assembly is complete, the browser downloads the PDF file.
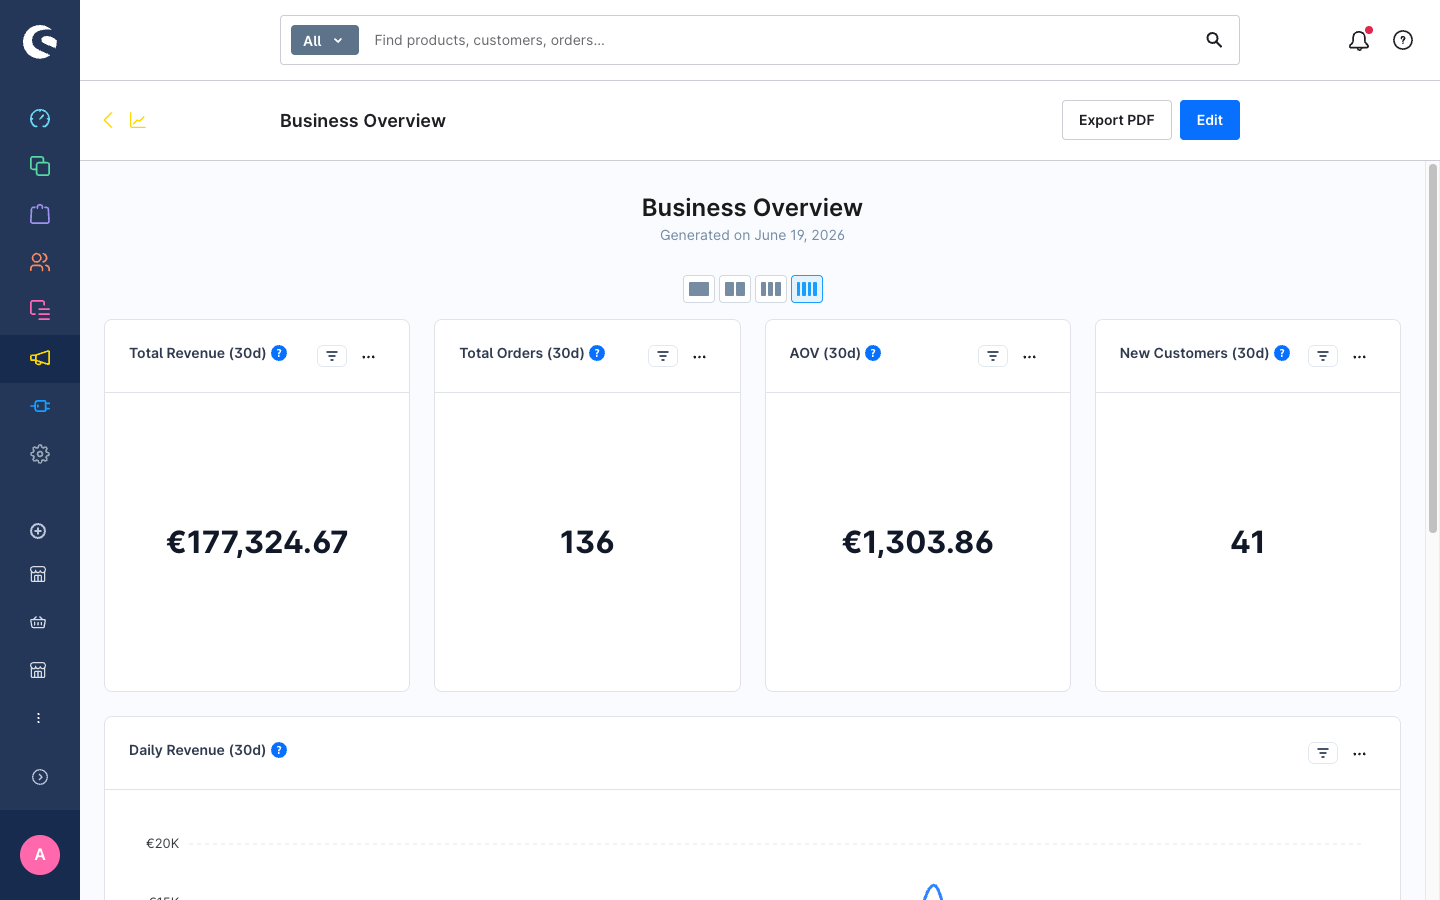
How it works: the export uses html2canvas to capture each chart card as an image, then assembles the pages with jsPDF. Charts are rendered in A4 landscape format. Charts that would overflow a page move to the next page automatically (break-inside: avoid).
Tips for a clean PDF:
- The column layout switcher and context menus are hidden during capture — the exported PDF always shows the charts without UI chrome.
- If a chart uses SVG rendering (ApexCharts), it scales cleanly to the PDF resolution.
- Badge colors are preserved in the capture output.
- For best results, use the same column layout you want in the PDF before clicking Export PDF. The PDF mirrors the on-screen column count.
Next steps
- Build a report — organize charts into a report suitable for PDF export.
- Create a chart — configure the filters and date range the CSV will export.