
How to build a report
A report is a named collection of charts displayed in a configurable grid. This guide covers creating a report, populating it with charts, adjusting the layout, and viewing or sharing the result.
Create a report
- In the Analytics module, click Reports in the navigation.
- Click Create report in the smart bar.
- Enter a Name for the report. The name field is translatable — use the language switcher to enter translated names if your shop runs multiple languages.
- (Optional) Set the Column layout — how many columns the report grid uses (1–4). You can change this at any time.
Add charts to the report
Add existing charts
- Click Add chart on the report edit page.
- The chart picker modal opens. Search by chart title, scroll through the list, or filter by data source.
- Select one or more charts. Charts already in the report are excluded from the picker.
- Click Add selected to confirm.
The chosen charts appear in the report grid.
Create a new chart inline
Click Create new chart on the report edit page. This navigates to the chart creation page. After saving, you return to the report and the new chart is automatically added.
Adjust the grid layout
Setting the column count: use the Columns selector in the report edit header. The value (1–4) sets how many equal-width columns the grid divides into. The effective column count is also capped by screen width (mobile: 1 column, tablet: max 2 columns, desktop: up to 4).
Resizing individual charts: every chart card in the edit view has a drag handle on its right edge. Drag it left or right to snap the chart's column span to 1, 2, 3, or 4 columns within the current grid. For example, in a 3-column report, you can make a KPI number card span 1 column and a trend line chart span 2 columns.
The resize handle snaps to column boundaries. A smooth FLIP animation shows neighboring cards reflowing. Chart spans are saved as part of the report's layout field.
Default spans when no span has been set: Number cards default to 1 column; Tables default to the full grid width; all other chart types default to 2 columns.
Resetting spans: clicking the column count selector resets all charts to span 1 column in the new grid, so you can start the layout from scratch.
Reorder charts
Drag and drop chart cards within the edit grid to reorder them. The sort order is persisted in the report's layout field when you save.
Remove a chart from the report
Click the remove icon (trash or ×) on a chart card in the edit grid. This removes the chart from the report without deleting the chart itself from the library.
Save and view the report
Click Save in the smart bar. The unsaved-changes guard is active: navigating away without saving opens a confirmation modal.
To view the finished report in read-only mode, click View in the smart bar or navigate to the report view page.
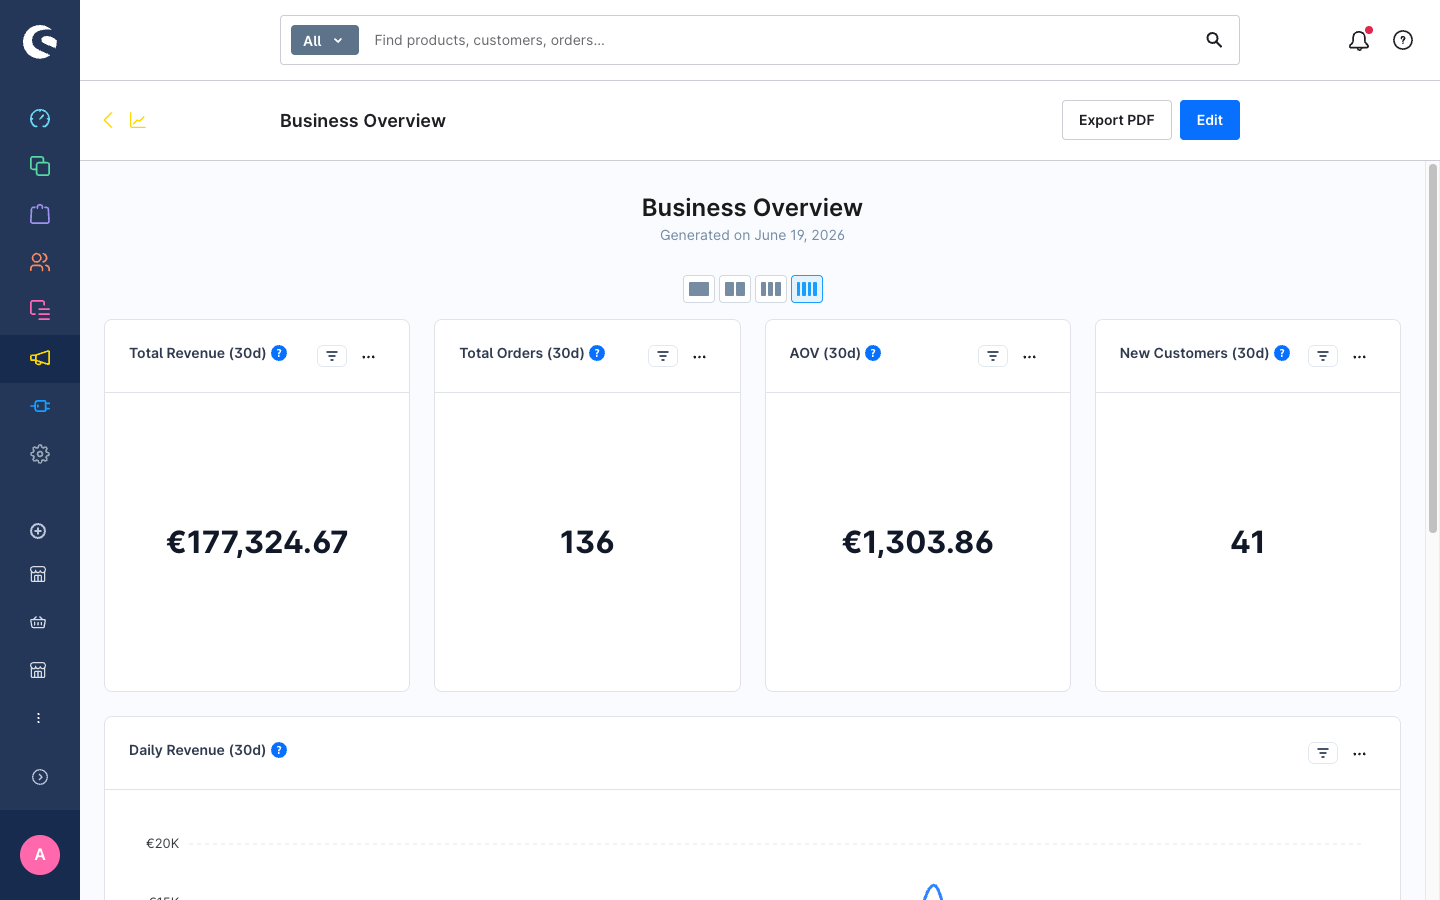
Adjust the layout in the report view
The report view also has a column layout switcher (1–4) in its header. This controls the read-only grid independently of the edit-page setting, letting you choose a compact view or a wide view for the same report without editing it.
Delete a report
From the report list page, use the delete action (trash icon or the row context menu). System-seeded reports (marked is_system = true) cannot be deleted.
Next steps
- Pin charts to the dashboard — surface key charts from this report on the Shopware dashboard.
- Export data — export the full report as PDF or individual charts as CSV.
- Set the overview report — make this report the Analytics landing page.