
How to create a chart
This guide shows how to configure a chart from scratch on the chart detail page. It assumes you have completed the getting started tutorial and are familiar with the Analytics module layout.
Open the chart creation page
In the Analytics module, click Charts in the navigation, then Create chart in the smart bar. You can also create a chart inline while editing a report: click Create new chart on the report edit page.
Configure the data source and metric
1. Select a data source
Choose which Shopware entity the chart should query:
| Data source | Queries |
|---|---|
| Orders | Order records (count, sum, or average of monetary fields) |
| Customers | Customer records (count only) |
| Products | Product records (count, sum, or average of stock/price fields) |
| Line items | Individual order line items (count, sum, or average of quantity/price fields) |
2. Select a metric
The available metrics depend on the data source:
- Count — number of records in the time bucket.
- Sum — total of a chosen numeric field.
- Average — mean value of a chosen numeric field.
When you pick Sum or Average, a Metric field selector appears. Available fields per data source:
| Data source | Sum/Avg fields |
|---|---|
| Orders | amount_total, amount_net, shipping_total, position_price (sum); amount_total, amount_net (avg) |
| Products | stock, available_stock (sum); price, stock (avg) |
| Line items | quantity, total_price (sum); unit_price, total_price (avg) |
3. Select a chart type
| Type | Best for |
|---|---|
| Line | Trends over time |
| Bar | Comparisons across time buckets or categories |
| Pie | Proportional breakdowns (percentage of a whole) |
| Donut | Same as pie, with a center label showing the total |
| Number | Single KPI with optional delta vs previous period |
| Table | Raw tabular data, sortable |
4. Set the time granularity
Granularity controls how data is bucketed on the time axis: Day, Week, Month, Quarter, or Year.
For Number and Pie/Donut charts, granularity still controls the underlying aggregation period but is not shown as an axis.
Set the date range
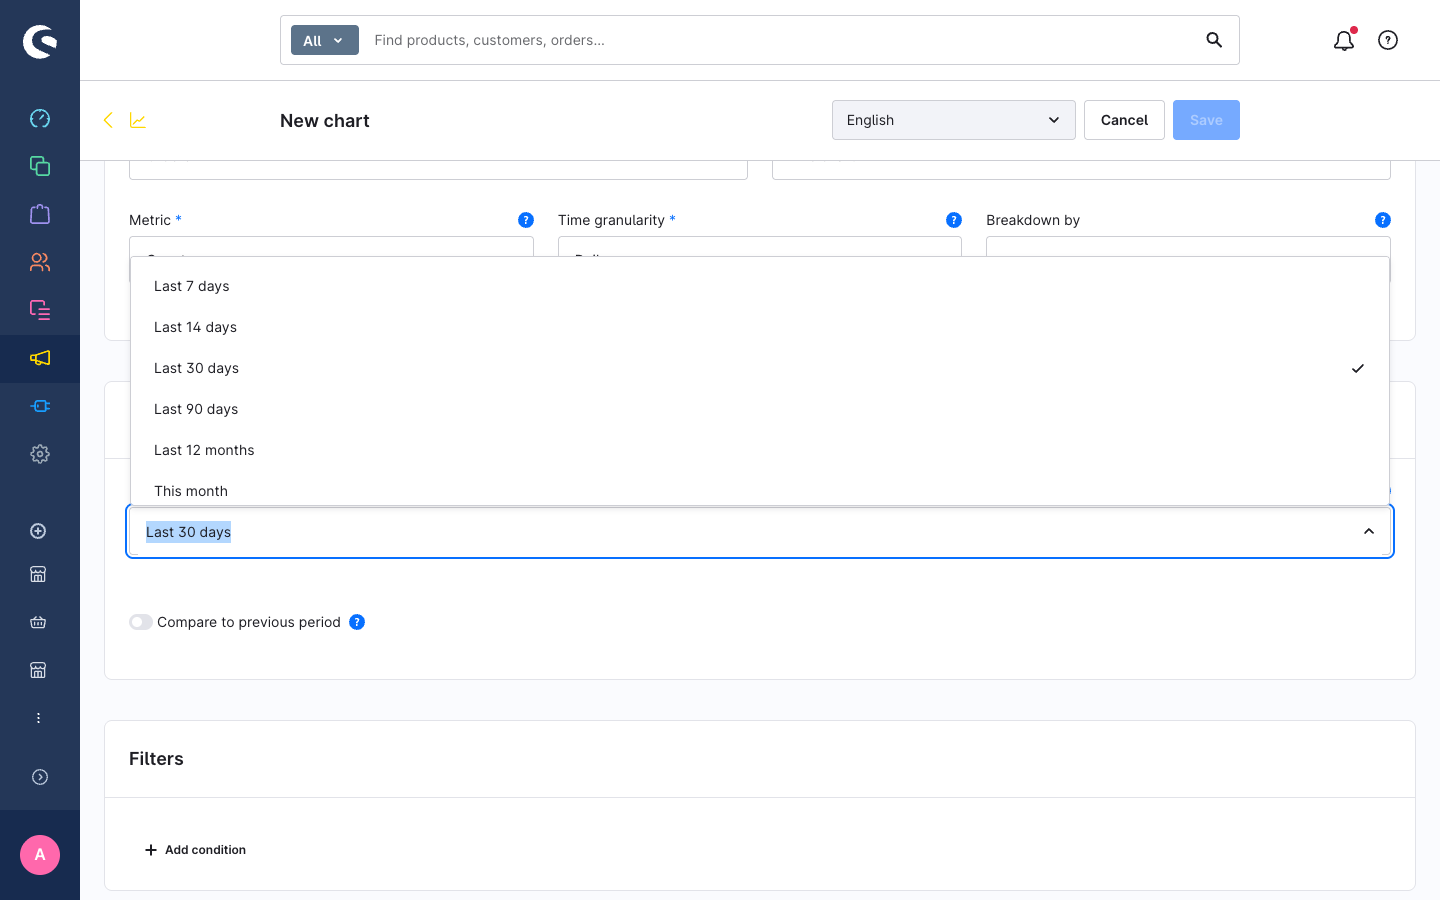
Choose a preset from the Date range dropdown:
- Last 7 / 14 / 30 / 90 days
- This month / quarter / year
- Last year
- Custom — shows a start and end date picker
Add filters
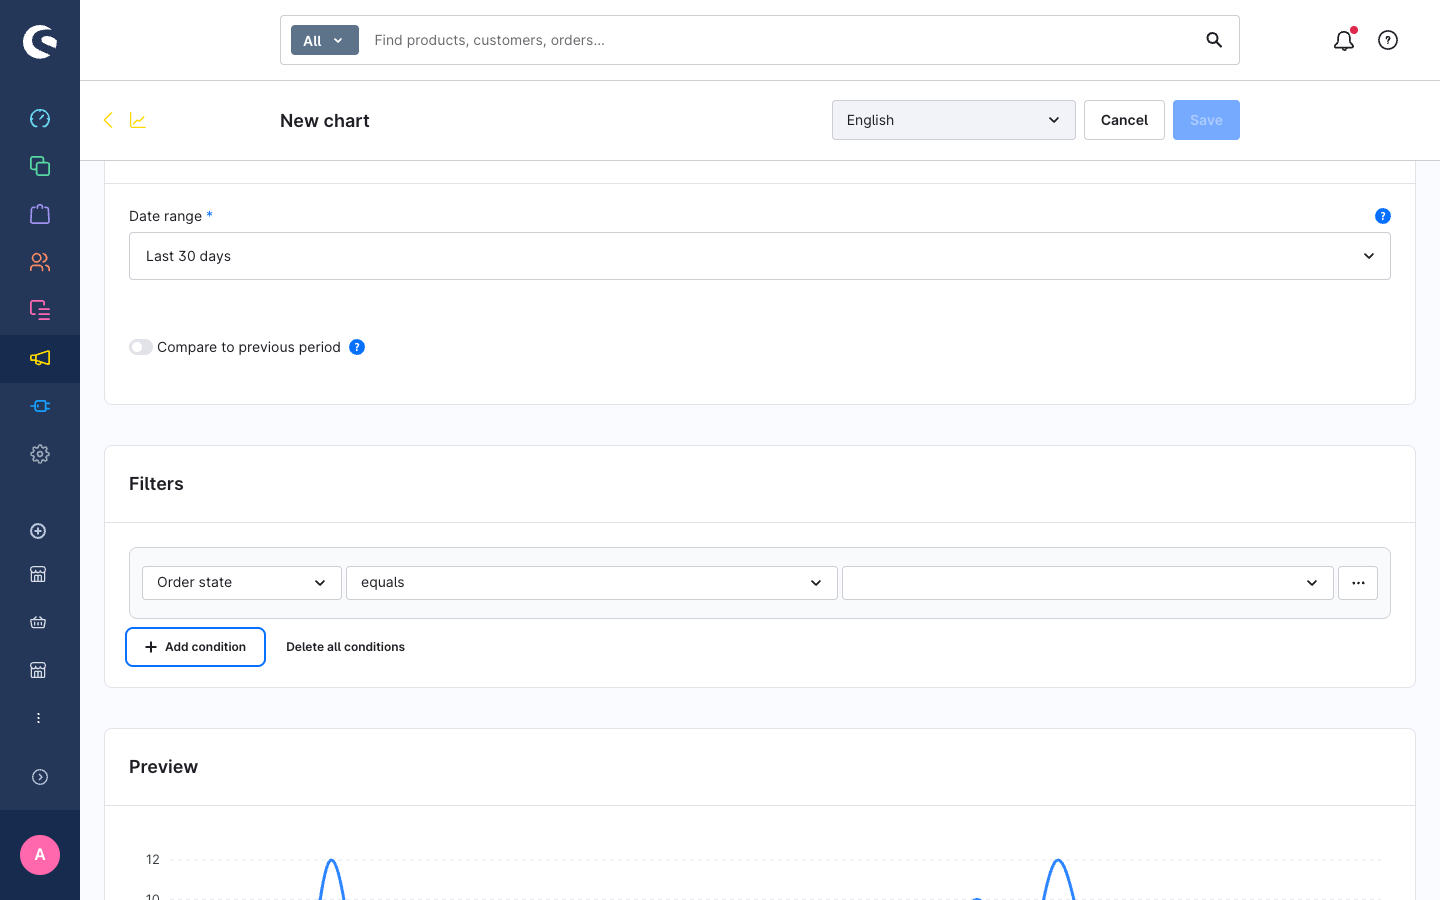
Filters narrow the query to a subset of records. Click Add filter to open a new filter row.
Filter structure: each row is [Property] [Operator] [Value].
Available operators depend on the property type:
| Property type | Available operators |
|---|---|
| Entity (sales channel, currency, country, etc.) | equals, not equals, is set, is not set |
| Boolean (active, guest) | equals (true / false) |
| Text / number (affiliate code, campaign code, etc.) | equals, not equals, contains, does not contain, greater than, less than, is set, is not set |
Filters combine with AND logic — all conditions must match for a record to be counted.
Tip: Leaving a filter value empty means the filter is not applied. A half-configured filter row is silently skipped, not treated as an error.
Add a breakdown (optional)
A breakdown splits the chart series by a property — for example, showing revenue per sales channel as separate lines on one chart.
Select a property from the Breakdown dropdown. Available breakdown properties depend on the data source (for example, Orders supports breakdown by sales_channel_id, currency_id, state_id, payment_method_id, shipping_method_id, billing_country_id).
Only one breakdown is supported per chart in this version.
Enable previous-period comparison
Toggle Compare to previous period to have the query also fetch the equivalent prior period automatically:
- Last 7 days → compared to the 7 days before that.
- This month → compared to last month.
- Custom range → the same duration shifted back in time.
On line, bar, and area charts, the previous period appears as a second series. On Number cards, it shows as a signed delta badge (e.g. +12.3% or −4.5%).
Add a title and description
The chart title is translatable. Use the language switcher at the top of the form to enter the title in other languages. The description field is optional and appears as a subtitle on the chart card.
Save the chart
Click Save in the smart bar. If there are validation errors (for example, a required field is empty), they appear highlighted on the form.
The unsaved-changes guard is active: navigating away while there are unsaved edits opens a confirmation modal offering to save, discard, or cancel.
Edit an existing chart
From the chart list, click the chart name or select Edit from the context menu on the right-side preview pane. Changes are live-previewed as you edit.
Next steps
- Build a report — add your chart to a report and configure the grid layout.
- Export data — export the chart's data as CSV.
- Configuration reference — entity field definitions and ACL permissions.